Observability
Introduction
For observability, the framework supports Application Performance Monitoring(APM) abd Business Performance Monitoring(BPM) out of the box. This includes distributed trace context propagation across sync and async channels, logging and basic metrics.
For the same, we are leveraging the OpenTelemetry standard and its supporting tech ecosystem.
Not even a single request must go untracked!
Architecture

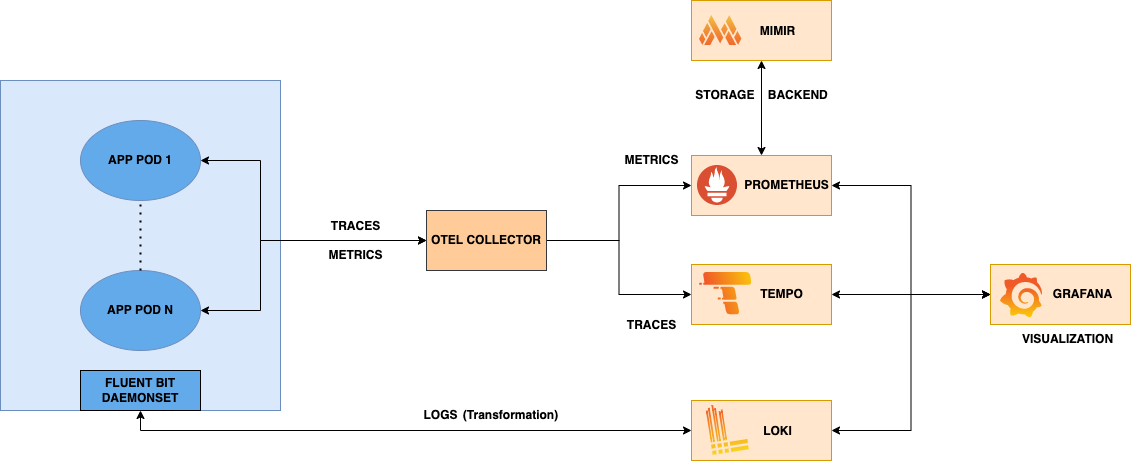
- Both Traces and Metrics are sent to OTEL Collector directly. Tempo is used as tracing backend for traces and Prometheus is used for metrics with Mimir as its backend.
- For Logs, a fluent bit daemonset is running on node, which collects logs from various applications on the node. Loki is used as logs aggregation solution.
Goals
Auto application performance monitoring
No code APM across microservices, integrable with standard APM tools and logging backends, without any dev effort.
Backend agnostic
Numerous open source and commercial softwares for Observability support OpenTelemetry out of the box, allowing one to switch between them if needed.
Complete debuggability
Collect, correlate and debug signals across logs (events), traces and metrics, based on the request id and the attributes defined for the organization. For example, app version, function, DB query, K8s pod, domain, microservice etc.